How Healthy Are Our Watersheds?
Ways to Protect Our Watersheds
Stream Buffers
-Riparian Buffer & Rain Garden
-Buffer Handbook
-Sources of native plants
Upper Thornton River Watershed Study
RappFLOW is a member of the Orion Grassroots Network
People, Land and Water at the
Headwaters of the
Rappahannock River Basin
8 Taking a Closer Look at Watershed Health and Protection
In addition to the six factors used to compare the subwatersheds’ protection levels, this study explored other factors affecting the health of our watersheds. These include future development, climate change, private roads and driveways; road/stream crossings; stability of streambeds; residential and commercial landscaping and land management practices; agricultural land management practices; forestry and logging practices; sewage treatment plants; septic systems and other household sewage.
8.1 Future development
There are already on record in the County about twice as many parcels of land as there are parcels with dwellings on them. There are also parcels that under the current zoning regulations could be subdivided by right if the owner so chooses. In 2000, an analysis was made in order to estimate the impact on the County if all the existing and sub-dividable parcels were developed into residences. This build-out analysis used conservative assumptions, such as the assumption that half of all potential lots under 2 acres are not suitable for subdivision or construction, and that land under easement is not buildable. At 2.5 average persons per household, the build-out would show a population of 18,000 for the county, roughly two and a half times greater than the current population. The development patterns would add more than 500 miles of private roads and driveways to the landscape for a total of 900 miles as discussed below.
8.2 Climate change
The impact of climate change has already been observed in many ways in our locality. The loss of hemlock forests to the expansion of the hemlock woolly adelgid is but one example.[24] Nearly all hemlock forests in SNP have died, and forestry experts predict eventual loss of all hemlock forests in our area. The spread of the woolly adelgid (an invasive sap-sucking insect from Japan) has been abetted by the recent warmer winters. The hemlock’s shallow root system excels along riparian corridors, where the soil remains moist throughout the year. These shade-tolerant trees form dense canopies that provide cool refuge for fish and wildlife. Rich in biodiversity, eastern hemlock forests are (were) habitat for more than 120 different vertebrate species, including black bear, marten, fisher, bobcat, white-tailed deer, snowshoe hare, red squirrel, porcupine, ruffed grouse, pileated wood pecker and many other birds. Streams sheltered by hemlocks are more likely to contain brook trout.
Future strategies for protecting our watersheds and water quality and quantity will need to take into account the predicted climate changes for this area of Virginia. Current predictions suggest greater swings of temperature (higher highs and lower lows) as well as precipitation (droughts and wet periods).
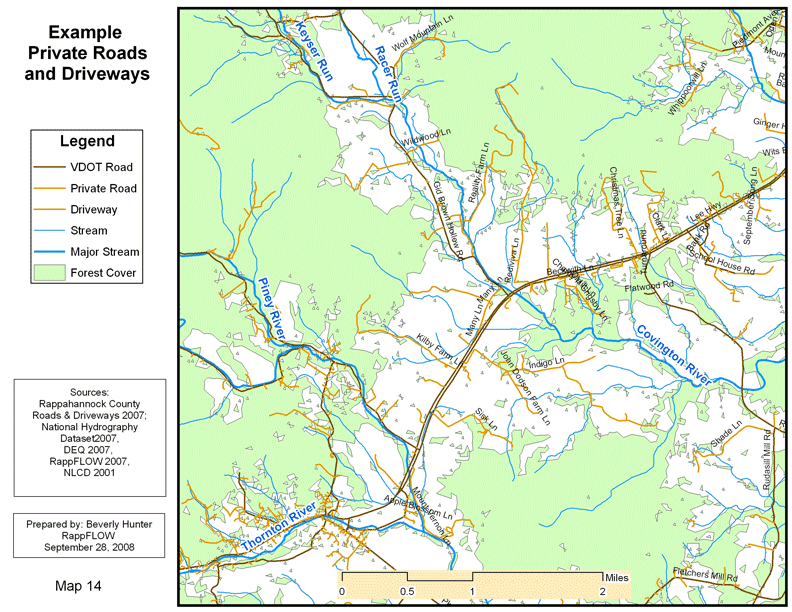
8.3 Private roads and driveways
In the county, there are more than 400 miles of privately maintained (mostly gravel or dirt surfaced) roads and driveways, sometimes on steep slopes. This is nearly 60 percent of all road miles in the county. These private roads are a major source of stormwater runoff, erosion, sedimentation, and other types of pollution in streams. In addition, roads going into forested areas fragment the forest. Map 14 shows private roads and driveways in a sample area of the County, based on the County’s E911 roads file.
8.4 Road/stream crossings
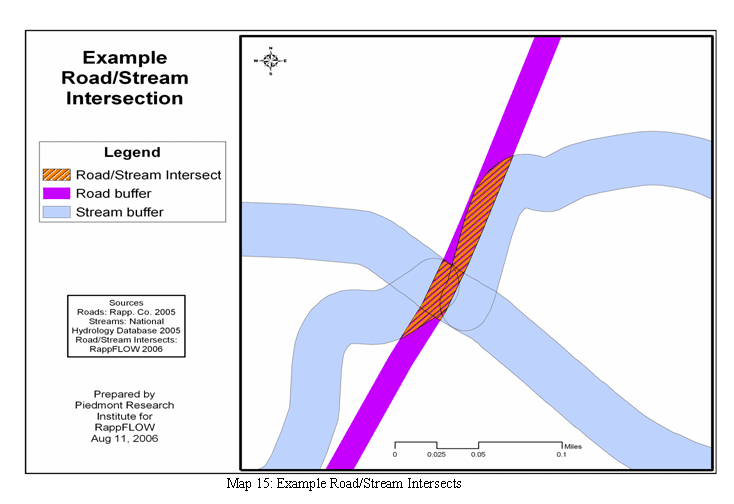
When a road crosses a stream or is in the stream buffer area, it may compromise the stream in several ways. Pollutants from vehicles and road maintenance easily wash into the stream. The impervious surface of the road causes stormwater to run quickly into the stream, increasing the erosion and sedimentation. Culverts channelize the water in the stream, making it flow faster during storms and thus causing damage to the stream banks. Culverts interfere with migration of small fish. Roads break up the forest cover, reducing the passageway for wildlife.
For the 14 subwatersheds in the Upper Thornton River Watershed, we identified areas where roads intersect with streams. The stream buffer area is 100 feet on both sides of the streams. The road buffer area is 40 feet for secondary roads and 100 feet for major highways. This is illustrated by example in Map 15. We then computed for each subwatershed the total acreage of road/stream intersections.
Subwatershed |
Subwatershed |
Subwatershed |
Stream Miles |
Acres of Road/Stream |
Upper North Fork |
5753.17 |
8.99 | 16.33 |
2.67 |
Piney |
4780.44 |
7.47 |
14.17 |
8.22 |
Big Branch |
2015.77 |
3.15 |
9.11 |
9.77 |
Five Forks |
4688.22 |
7.33 |
22.41 |
10.63 |
Lower Rush |
2855.35 |
4.46 |
23.02 |
12.26 |
Racer Run |
2468.74 |
3.86 |
8.34 |
12.80 |
Beaverdam Creek |
3101.42 |
4.85 |
14.95 |
19.07 |
Keyser Run |
3816.94 |
5.96 |
11.59 |
20.06 |
White Walnut Run |
5038.70 |
7.87 |
21.94 |
25.32 |
Middle Rush |
3128.81 |
4.89 |
23.00 |
28.32 |
Covington |
5554.93 |
8.68 |
30.31 |
32.19 |
Upper Rush |
6766.90 |
10.57 |
28.07 |
46.59 |
North Fork Thornton |
2873.24 |
4.49 |
24.20 |
53.67 |
South Fork Thornton |
6782.88 |
10.60 |
18.80 |
54.55 |
Table 5: Acres of Road/Stream Intersection in the Upper Thornton River Subwatersheds.
8.5 Stability of Streambeds
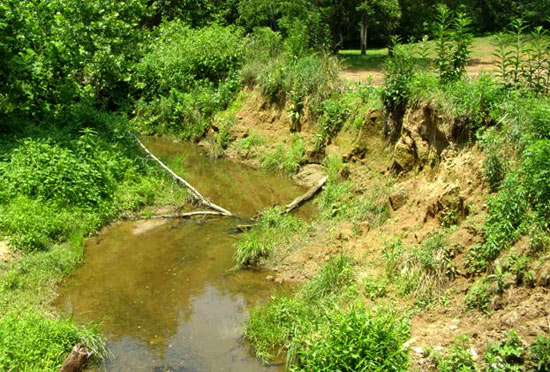
Unstable, eroding streambeds are commonly seen across the County, in both residential and agricultural areas. Streambeds in this condition promote soil erosion and siltation of the water, which damages the habitat for fish and other aquatic life. There are many causes of streambank erosion, but the most commonly observed is the lack of forested buffer area adjacent to the stream. Preventing streambed erosion is far less expensive than is restoration of a damaged streambed.
8.6 Residential and commercial landscaping and land management practices
RappFLOW volunteers with technical assistance from the Culpeper Soil & Water Conservation District conducted site visits to evaluate land management practices on residential and commercial properties. Volunteers also developed, tested, and trained others in the use of a Riparian Buffer Evaluation Handbook.[25] A list of recommended native trees, shrubs and grasses for riparian buffers, and a list of nurseries for native plants, are some of the other resources developed to assist landowners in protecting and restoring stream buffer areas. The volunteers also restored a riparian buffer area on a large commercial property in Sperryville, thus gaining first-hand experience. This area serves as an educational place for citizens to learn about stream buffers, and public workshops are held there. Another outcome of this work was a set of guidelines for landowners.[26] The following are some of the key concepts and practices that could be easily adopted by any residential landowner:
Advice to Residential Landowners
You can do something on your property that can help the watershed and also meet your desires.
Watershed protection goals are to prevent pollution from entering our streams, recharge groundwater, and reduce flooding.
Small streams are as important as larger streams.
The primary pollutants of concern are Nitrogen, Phosphorous, sediment, and bacteria.
Trees, shrubs, and tall grasses in the area beside the stream are “the last line of defense” in keeping pollution out of the stream. They stabilize the stream bank. The trees help keep the water cooler and provide beneficial “leaf litter” for the stream. These actions of the buffer greatly improve the water quality, making better “homes” for fish and other critters in the stream. Proper buffers can transform a stream from having no fish, into a stream that “cold water” fish like Trout can thrive in.
Buffers can be improved in many ways. It can be as simple as not mowing 35 to 50 feet
along the stream and letting the trees that want to be there develop. Even 15 feet can be better than no buffer at all!
You can develop an attractive landscaping plan and then plant native trees, shrubs, and other native plants.
If it’s important to you to keep a nice waterfront view, do it with “clever” landscaping -- use more low-growing plants, pathways and seating areas.
Make sure that there is not a “back door” for water to enter the stream, such as a drainage ditch or a pipe that circumvents the buffer. Many of the benefits of the buffer are then lost!
Take a holistic view when looking at the property. Observe what happens with runoff in a heavy rain. Look at overall drainage, lawns, swales, and ponding areas. There are many things that can be done on the property BEFORE runoff reaches the stream or drainage ditch. The “mantra” is to SLOW the water down, let it seep into the ground. For instance, you could select an area to stop mowing and let it grow up into a forested area. This will be a haven for many interesting forms of wildlife, birds, and butterflies.
Proper lawn care practices can make an incredible difference, don’t cost anything and can actually save money! Five important things to consider are:
1. Mow higher, say 4 inches instead of 2 inches. It’s is better for the grass and will help rainwater infiltrate into the soil – it SLOWS the water down. The higher you mow, the deeper the roots of the grass grow. This can help the grass in dry weather conditions because the roots are reaching farther down to get moisture. The grass uses the nutrients in the runoff and removes pollution from the shallow groundwater, and this also helps keep pollution from going into the deeper groundwater that our wells use for our water supply.
2. Fertilize only as needed. Healthy grasses and soils need less fertilizer.
3. Don’t rake up the clippings – these are actually a form of “free” fertilizer and they return nutrients to the soil.
4. Be very selective about using herbicides, and be sure they biodegrade quickly.
5. Clean up after pets – this is a source of pollution just like cow or horse manure.
8.7 Agricultural land management practices
Agricultural land management practices, especially those affecting livesk on pastures, are by far the largest factor in protecting the water quality in streams in Rappahannock County. According to the study Bacteria Total Maximum Daily Load Development for the Rappahannock River Basin[27], pastures constitute over 95% of the source of E. coli bacterial contamination of streams in the watersheds to the impaired stream segments. If animals are actually in the stream, they also destabilize streambanks, create erosion and sedimentation, and add high levels of nutrients to the water.
Since 2004, the county’s farmers have protected 1,271.4 acres of pasture and stream buffer through Virginia cost-sharing programs for Best Management Practices, as follows:
YEAR |
# PROJECTS |
ACRES PROTECTED |
| 2004-05 | 11 |
190.1 |
| 2005-06 | 6 |
98.1 |
| 2006-07 | 10 |
395.5 |
| 2007-08 | 13 |
584.7 |
In addition, 33 landowners have taken advantage of the USDA’s CREP cost-sharing program to restore and protect about 825 stream buffer acres since the program’s inception in 2000.
8.8 Forest Management
Conservation of forested lands and the economic and ecological sustainability of those forested lands are central to the future health of the watersheds. There has been a small amount of logging operations in the County in recent years. In the year July 2006 – June 2007, the DOF reported a total of 1,082 acres of logging in the County. In the year July 2007 – July 2008, 635 acres were reported.
Conservation and sustainability depend upon landowner education and forest management planning. Invasive species are the most significant threat to forest health.[28] Drought and record-high temperatures have exacerbated the impacts on previously stressed tress, leading to secondary insect and disease problems and tree mortality.
A Sustainable Forestry Task Force was created by a group of volunteer citizens in 2008[29]. This task force and the VA Department of Forestry are conducting programs of education for owners of forested land in Rappahannock County.
8.9 Sewage treatment plants
As discussed in section 6.1, about a third of respondents to our watershed survey said that public sewage treatment plant discharge to stream was one of the threats to their watershed that most concerned them. There are four sewage treatment permits in the county plus an inactive one in Shenandoah National Park. Two are for the high school and the elementary school. The permit for the town of Washington is not yet operational. One operational permit is the Sperryville Sewage Treatment Plant (STP). In 2005, some landowners questioned the possible sources of fecal coliform exceedance measured by the VA DEQ in the Thornton River below Sperryville. On three dates in spring of 2005, RappFLOW volunteers collected water samples in the Thornton River above and below the Sperryville Sewage Treatment Plant.[30] On our first sampling, FC levels just downstream of the Sperryville STP were slightly elevated and exceeded standards compared to FC levels collected upstream of the STP but this result was not repeated in the second testing. We collected a sample where the wastewater effluent pipe outlet enters the Thornton River. This level of 300 colonies was higher than the 140 colonies collected just upstream of the effluent discharge location. However, DEQ often allows wastewater treatment plants to maintain a mixing zone downstream of their effluent location so the river can dilute the waste and to reach acceptable levels.
They did not find any significant difference in the levels of fecal coliform in samples above and below the plant at the confluence of the North and South Fork of the Thornton River.
The Sperryville Sewage Treatment Plant (STP) is required by its DEQ permit to monitor certain water quality parameters from its effluent on a monthly basis and send this information to DEQ. We obtained historical data from VA DEQ for the Sperryville Sewage Treatment Plant covering a six-year period from February 1999 to April 2005. We compared the monthly parameter values to allowable limits set forth in the STP DEQ National Pollutant Discharge Elimination System Permit # VA0062880. Secondary wastewater treatments such as STP with design flows of 55,000 gallons per day are small package plants. They do not have a bacteria standard in their permit limits and they do not test for bacteria in their effluent or in the stream. Instead, they treat with chlorine levels suitable to kill bacteria. When chlorine levels measured as Total Contact Chlorine are equal to or greater than 1.0 mg/l, the levels are considered sufficient to kill FC to acceptable concentrations (<200 colonies per 100 mls water). In the 6-year effluent data the average Total Contact Chlorine level was 0.79mg/l. Prior to January 2002, the monthly average Total Contact Chlorine was 0.57 mg/l. No level of 1.0 mg/l Total Contact Chlorine was reached between February 1999 and January 2002. Whether the current Total Contact Chlorine level is sufficient to remove the bacteria warrants further study. Additional investigation is also needed to determine the duration of time the waste is exposed to the chlorine to ensure proper contact for efficient bacterial removal. [31]
Water quality parameters we evaluated for the Sperryville STP included ammonia, biological oxygen demand, dissolved oxygen, sediment loadings, and pH. There were four exceedances of allowable STP permit levels over the 6-year time period. These exceedances were for ammonia levels above the permitted 5.1 mg/l in the wastewater effluent. These occurred in 2000 and 2001 (ammonia levels of 6.2 mg/l, 9.8, 5.5, and 25.8). There was no correlation between the elevated ammonia concentrations and water flow levels. The average dissolved oxygen in the STP effluent was 7.6 mg/l, thereby meeting their permit requirements for being above a minimum of 6.0.
The Biological Oxygen Demand (BODB5B) in the STP effluent was a monthly average of 8.0, well within the allowable 30 mg/l permit requirement, although several peaks were near 30 mg/l. Typical streams in our area have a BODB5B of 2-4 mg/l.
8.10 Septic Systems
Nearly all residents of the County depend on private septic systems (except Sperryville and in future, the town of Washington). Septic systems are designed to filter septic tank effluent through the soil allowing removal of bacteria and nutrients from the wastewater. Septic system failure is manifested by the rise of effluent to the soil surface. Surface runoff can transport the effluent containing fecal coliform to receiving waters.
The following information is from the TMDL Study referenced earlier. It addresses the Rush River in particular, but similar methods and conclusions also apply to other impaired stream watersheds.
In accordance with estimates from Dr. Raymond B. Reneau, Jr. from Virginia Tech, a 40% failure rate for systems designed and installed prior to 1984, a 20% failure rate for systems designed and installed between 1985 and 1994, and a 3% failure rate on all systems designed and installed after 1994 was used in the development of the Rush River (VAN-E05R-01) TMDL. An average number of people per household and number of houses and people in each subwatershed in 2006 were established using 1990 and 2000 U.S. Census Bureau demographics data (UCSB, 1990 and 2000). The applicable failure rate was multiplied by each total and summed to get the total failed septic systems per subwatershed. Daily total fecal coliform load to the land from a failing septic system in a particular sub-watershed was determined by multiplying the average household occupancy rate for that subwatershed by the per capita fecal coliform production rate of 1.95×10⁹ cfu/day (Geldreich et al., 1978). Hence, the total fecal coliform loading to the land from a single failing septic system in a subwatershed with an occupancy rate of 2.09 persons/household was 4.08×10⁹ cfu/day. Transport of some portion of the fecal coliform to a stream by runoff may occur during storm events. The number of failing septic systems in the watershed is given in Table 3.25.
Straight Pipes. Houses that deliver a waste load directly to the stream, or straight pipes, were estimated by identifying those houses located within 150 feet of streams in the pre-1967 and 1967-1987 age categories. Any houses within 150 ft of streams are considered potential straight pipe dischargers. Using the age categories (pre-1967, 1967 – 1987, post 1987), 10% of old houses (pre-1967) within 150 ft of streams and 2% of mid-age houses (1967 – 1987) within 150 ft of streams are assumed to be straight pipe dischargers (CTWS, 2004). This method yielded 15 houses that potentially could be classified as straight pipes in the Rush River (VAN-E05R-01) watershed (Table 3.25).
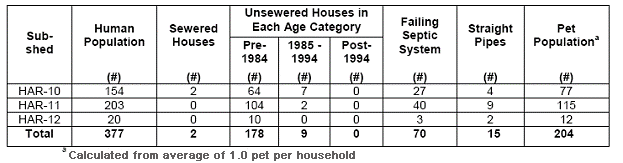
Estimated human population, number of sewered houses, number of unsewered houses by age category, number of failing septic systems, number of straight pipes, and pet population in the Rush River watershed. (Table 3.25 from the TMDL Study).
Next: Indicators of water quality
and quantity
Back to TOC