How Healthy Are Our Watersheds?
Ways to Protect Our Watersheds
Stream Buffers
-Riparian Buffer & Rain Garden
-Buffer Handbook
-Sources of native plants
Upper Thornton River Watershed Study
RappFLOW is a member of the Orion Grassroots Network
People, Land and Water at the
Headwaters of the
Rappahannock River Basin
9 Indicators of water quality and quantity
To assess the quality of surface water in the 755 miles of streams and 540 acres of ponds in the County, there are only a few sources of data, and these provide information regarding water quality in a small sample of locations. The sources include the following:
- There are four stream segments that have been designated 303d “Impaired” for E. coli by the DEQ. See Map 16.
- Countywide, there are about 12 DEQ ambient monitoring stations, although not all are currently active. See Map 16.
- There are currently 8 locations where citizens monitor the macroinvertebrates.
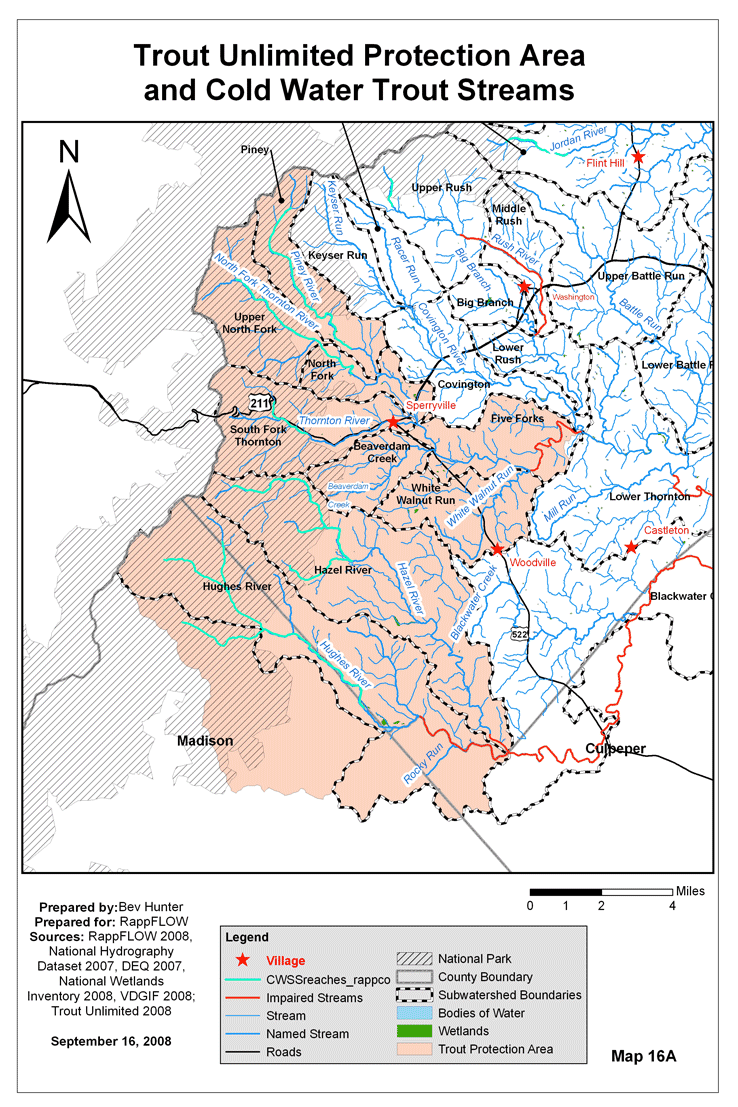
- There are some streams classified by the Virginia Department of Game and Inland Fisheries as coldwater or trout streams, and these are within subwatersheds designated by Trout Unlimited as Brook Trout Protection Area.
- RappFLOW volunteers have sampled chemical and biological water quality in selected locations as part of special studies at requests of landowners.
- To measure quantity of surface water, there is one USGS streamflow gage, located in Laurel Mills.
- There are no groundwater monitoring stations in the county. The nearest one is near Berryville.
9.1 Impaired stream segments: what they mean and do not mean.
Segments of the Rush, Thornton, Hughes, Hazel and Rappahannock Rivers in Rappahannock County have been designated “303d Impaired” for fecal coliform or ecoli bacteria by the Virginia Department of Environmental Quality. [32] The goal of the Clean Water Act is that all streams should be suitable for recreational uses, including swimming and fishing. Fecal coliform and E. coli bacteria are used to indicate the presence of pathogens in streams supporting the recreational use goal. Bacteria in certain segments of the Hughes River (VAN-E03R-01), Hazel River (VAN-E04R-01), Rush River (VAN-E05R-01), Hazel River (60076), Rappahannock River and Thornton River exceed the fecal coliform criterion. [33]
Pollution from both point and nonpoint sources can lead to fecal coliform bacteria contamination of water bodies. Fecal coliform bacteria are found in the intestinal tract of warm-blooded animals; consequently, fecal waste of warm-blooded animals contains fecal coliform. Even though most fecal coliform are not pathogenic, some forms can be harmful to human health and their presence in water indicates recent contamination by fecal material. Because fecal material may contain pathogenic organisms, water bodies with fecal coliform counts may also contain pathogenic organisms. For recreational activities involving contact with water, such as boating and swimming, health risks increase with increasing fecal coliform counts. If the fecal coliform concentration in a water body exceeds state water quality standards, the water body is listed for an exceedance of the state fecal coliform standard for contact recreational uses. Virginia has adopted an Escherichia coli (E. coli) standard for water quality. The concentration of E. coli (a subset of the fecal coliform group) in water is considered to be a better indicator of pathogenic exposure than the concentration of the entire fecal coliform group in the water body.
It is important to understand what these “impaired” designations tell us, and what they do not tell us, about water quality in Rappahannock County’s streams. First, one might easily infer that streams other than the designated “impaired” streams are NOT impaired, but that is not correct. RappFLOW volunteers sampled stream waters within the subwatersheds of two “impaired” stream segments and in subwatersheds that are upstream of the impaired stream subwatersheds. They found very high levels of fecal coliform or ecoli bacteria in some of the streams.[34] Those streams are NOT designated as “impaired” by the state. Therefore the citizen should not infer that because their stream has not been designated as “impaired” that it is therefore safe to swim or wade or go tubing in the stream.
Secondly, one might infer that since the impaired designation is based only on bacteria levels, that there are not other excessive pollutants in those impaired streams, such as excessive nutrients or suspended solids from erosion and sedimentation. This is also incorrect. There do not exist state standards by which to evaluate nutrients or turbidity in the streams, so therefore we do not have “impaired” designations for those. Similarly, a stream might lack the level of dissolved oxygen needed to support certain fish species, but not be designated as “impaired” under this system.
9.2 DEQ Ambient Monitoring Stations Data[35]
DEQ staff in each of the regional offices collects water samples on a routine schedule at more than 1,000 locations across the Commonwealth. These water samples are shipped to a state laboratory for chemical and bacterial tests. The samples are tested for levels of nutrients, solids, bacteria associated with human and animal wastes, toxic metals, some pesticides and harmful organic compounds.
DEQ's scientists also perform on-the-spot field tests for dissolved oxygen, pH, temperature, salinity, and additional indications of water quality. Samples from the mud at the bottom of lakes and rivers also are tested for the presence of pesticides and other harmful compounds.
The DEQ ambient monitoring stations in the County are shown on Map 16.
9.3 Citizen Macroinvertebrate Monitoring Stations[36]
Volunteers trained and certified in the Virginia Save Our Streams (VA SOS) method, monitor macroinvertebrates (tiny critters) in streams. Volunteers in Rappahannock County participate in the Upper Rappahannock Watershed Stream Monitoring Program, led by the Culpeper Soil and Water Conservation District and the John Marshall SWCD (Fauquier County). The result is summarized by an index, in which a score of 0 – 6 is considered “unacceptable” and a score of 7 – 12 is “acceptable” water condition. The higher the score, the healthier the stream.
The locations currently monitored by citizen monitoring are shown on Map 16.
Stream-bottom macroinvertebrates differ in their sensitivity to water pollution. Some stream-bottom macroinvertebrates cannot survive in polluted water. Others can survive or even thrive in polluted water. In a healthy stream, the stream-bottom community will include a variety of pollution-sensitive macroinvertebrates. In an unhealthy stream, there may be only a few types of nonsensitve macroinvertebrates present.
Stream-bottom macroinvertebrates provide information about the quality of a stream over long periods of time. It may be difficult to identify stream pollution with water analysis, which can only provide information for the time of sampling. Even the presence of fish may not provide information about a pollution problem because fish can move away to avoid polluted water and then return when conditions improve. However, most stream-bottom macroinvertebrates cannot move to avoid pollution. A macroinvertebrate sample may thus provide information about pollution that is not present at the time of sample collection.
9.4 Coldwater Streams and Brook Trout Protection Area
Certain subwatersheds in Rappahannock County are included in the Trout Unlimited Brook Trout Protection area. See Map 16A. Brook trout require high water quality in cold water streams surrounded by forest land cover, and to survive a population requires high ability to travel from one small stream to another, unimpeded by obstacles such as culverts. According to Trout Unlimited,
A recent assessment by the Eastern Brook Trout Joint Venture examined conditions from Ohio to Maine to Georgia and determined that brook trout populations in streams and rivers remain undisturbed in less than 5% of their historic subwatersheds. Brook trout are extirpated from 21% of subwatersheds. …Like other salmonids in the char genus, brook trout are intolerant of water pollution and non-native fish, and are classic indicators of water quality and ecosystem integrity….Virginia contains a concentration of protection priorities at existing population strongholds, particularly in portions of the headwaters of the Potomac, Rappahannock and James Rivers.[37]
9.5 Special water quality studies
Volunteers have been trained to conduct water quality samples using state-approved procedures and equipment, and RappFLOW has received small grants from state and private agencies for equipment to test chemical and biological indicators of water quality. Special studies were undertaken in the spring of 2005 in the Beaverdam Creek subwatershed and in the summer of 2006 in the Rush River subwatersheds.
9.6 Precipitation and Surface Water Flow Measurements
There is one USGS stream flow gage in the County, on Battle Run near Laurel Mills.[38] One can obtain historical data for this site for analysis of trends over time. Below is the information on data available.
USGS 01662800 BATTLE RUN NEAR LAUREL MILLS, VA
Stream/River Site
|
|
|||||||||||||||||||||||||||||||||||||||||||||||||||||||||||||||||
Table 6: Stream Gage Data Available from USGS
Chart 2 below shows an example of the recent flow data from the Laurel Mills gage. The triangles show the 47-year median daily statistic. Notice that after major rain event spikes, the base discharge of the stream is falling below the historic median. One speculation is that the lower base flow is due to reduced groundwater levels, but further research would be needed on groundwater in order to evaluate that idea.
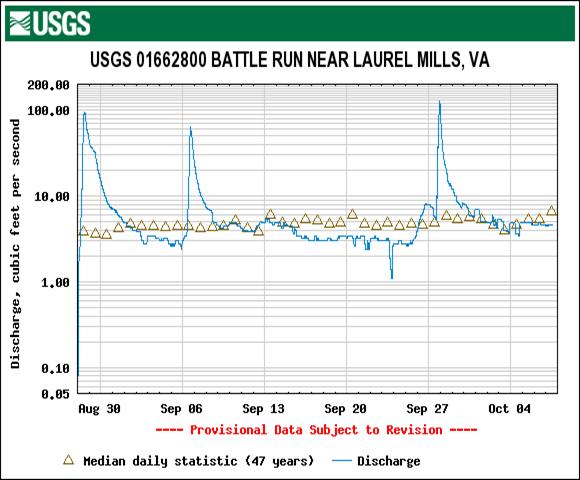
Chart 2: September 2008 Stream Flow Data at Laurel Mills Gage
9.7 Ground Water Measurements
There are currently no studies or instrumentation for measuring ground water levels and trends. This has been a subject of recent discussion with the Water Supply Planning office of the Virginia Department of Environmental Quality.
The USGS has 467 active water level monitoring wells in Virginia, but none in Rappahannock County. The nearest is near Front Royal. There are 46 monitoring wells in Clarke County and 50 in Frederick County.
9.8 Quantity and Quality of Well Water
Given the central importance of well water to 96% of residents in the county, there is a surprising lack of systematic and dependable data on the subject of the quantity and quality of well water countywide. The number of new wells drilled varies from year to year, but would probably average around 50. Sometimes a new well is drilled because a spring has gone dry, and a family had depended on the spring for household water.
The records on quantity of well water across the county are spotty. For about 25 years, the Department of Health has received information from well drillers when they drill a well. They provide logs showing basic construction details, including depth and yield. Given the lack of standard procedures for computing these data, however, it would not likely be useful to try to use these records to identify trends over time or location. Hence there is not currently a basis for determining trends regarding well yields. Anecdotally, there appear to be some places around the county where there have been some difficulties in drilling productive water wells.
With regard to water quality in wells, the majority of homeowners who have a problem typically take a sample of their water to one of several private testing labs.
In 1992, a study was made to evaluate the quality of household well water in Rappahannock County.[39] Tap water samples were taken from the homes of 236 volunteer homeowners in the County. These were analyzed for general water chemistry. Of those participants, 195 also submitted samples for bacteriological testing. A smaller subset of samples (40) were also tested for pesticides and other compounds.
In the “nuisance” category of chemicals, iron and manganese were the chemicals that were found most frequently to exceed EPA standards, but even for those the percent of cases were only six and seventeen percent respectively. Excessive manganese can cause dark stains on laundry and cooking utensils, and give the water a bitter taste. There is a “saturation index” is a measure of corrosion potential, or corrosivity, of the water. A saturation index less than zero indicates that the water may cause corrosion in pipes, leading to dissolved lead and copper concentrations due to corrosion of pipe walls and plumbing fixtures made of these materials. Values indicating corrosivity were determined for 86% of the raw water samples and 89% of the tap water samples. The natural lack of calcium in the water and the acidic nature of Rappahannock County water supplies both contributed to the excessive corrosion potential.[40]
The major health-related concerns were corrosivity (because of its effect on plumbing systems and the potential to raise dissolved copper and lead levels in water), and bacteria. Forty percent of the samples in the bacteriological analysis tested positive for total coliform and 16% for fecal coliform bacteria.
The limited pesticide analysis revealed few problems with such contamination. Only two of the 40 samples tested had concentrations of one or more of the 32 pesticides and other compounds analyzed present in quantities exceeding EPA Maximum Contaminant Levels or Health Advisory Levels. The chemicals found in excessive concentrations were alachlor, chlordane, heptachlor, and heptachlor epoxide.[41]
Next: Least-protected subwatersheds: The Lower Rush
Back to TOC